HOW to do DQ
- the preposition
The webpage How to do DQ provides DQ improvement processes that have been proven by good practice in diverse industries. I will call these DQ improvement processes DQ Lifecycles DQ LCs. In general, there are 3 Types of DQ LCs: Principles, Work Instructions WIs, and User Journeys UJs:
- Principles: A Principle is a proposition, that has been matured by experience with DQ (+DG+DC) in real life. Principles have been balanced and shared between stakeholders as consent and strong recommendation to be used within a corporate data culture. Principles guide users through a jungle of terms, taxonomies, articles, and definitions that are cumulated to rules and instructions. DQ Principles should have the character of best practice (sth. that has stand the tough test of practice and has been generalized).
- Work Instructions: A WI is an extended formulation of principles. It is quite similar to Principles, but with much more touch to details on dedicated actions within an organizational people schema. Principles are quite rigid, while WI are more dynamically enhanced with sub-processes or simply updated. WIs do not leave the DQ LC / process level. DQ WI should have the character of good practice (sth. that is particularly well-proven in practice).
- User Journeys: UJs are equivalent to IT epics. Beyond the DQ LC guidance, UJ describe DQ with business variables in natural language. UJs fill Principles and WIs literally with life. DQ UJ are adjusted to good practice.
DQ roadmaps and heatmaps might transparently visualize the location of Principles, WIs, and UJs. Roadmaps and heatmaps are wonderful complements to mindmaps, making concepts or processes fully understood.
Due to diverse regulations the process of HOW TO DO DQ calls for deep root cause investigations and thorough remediations. Please reach out for further details.
How to do DQ
- the proposition
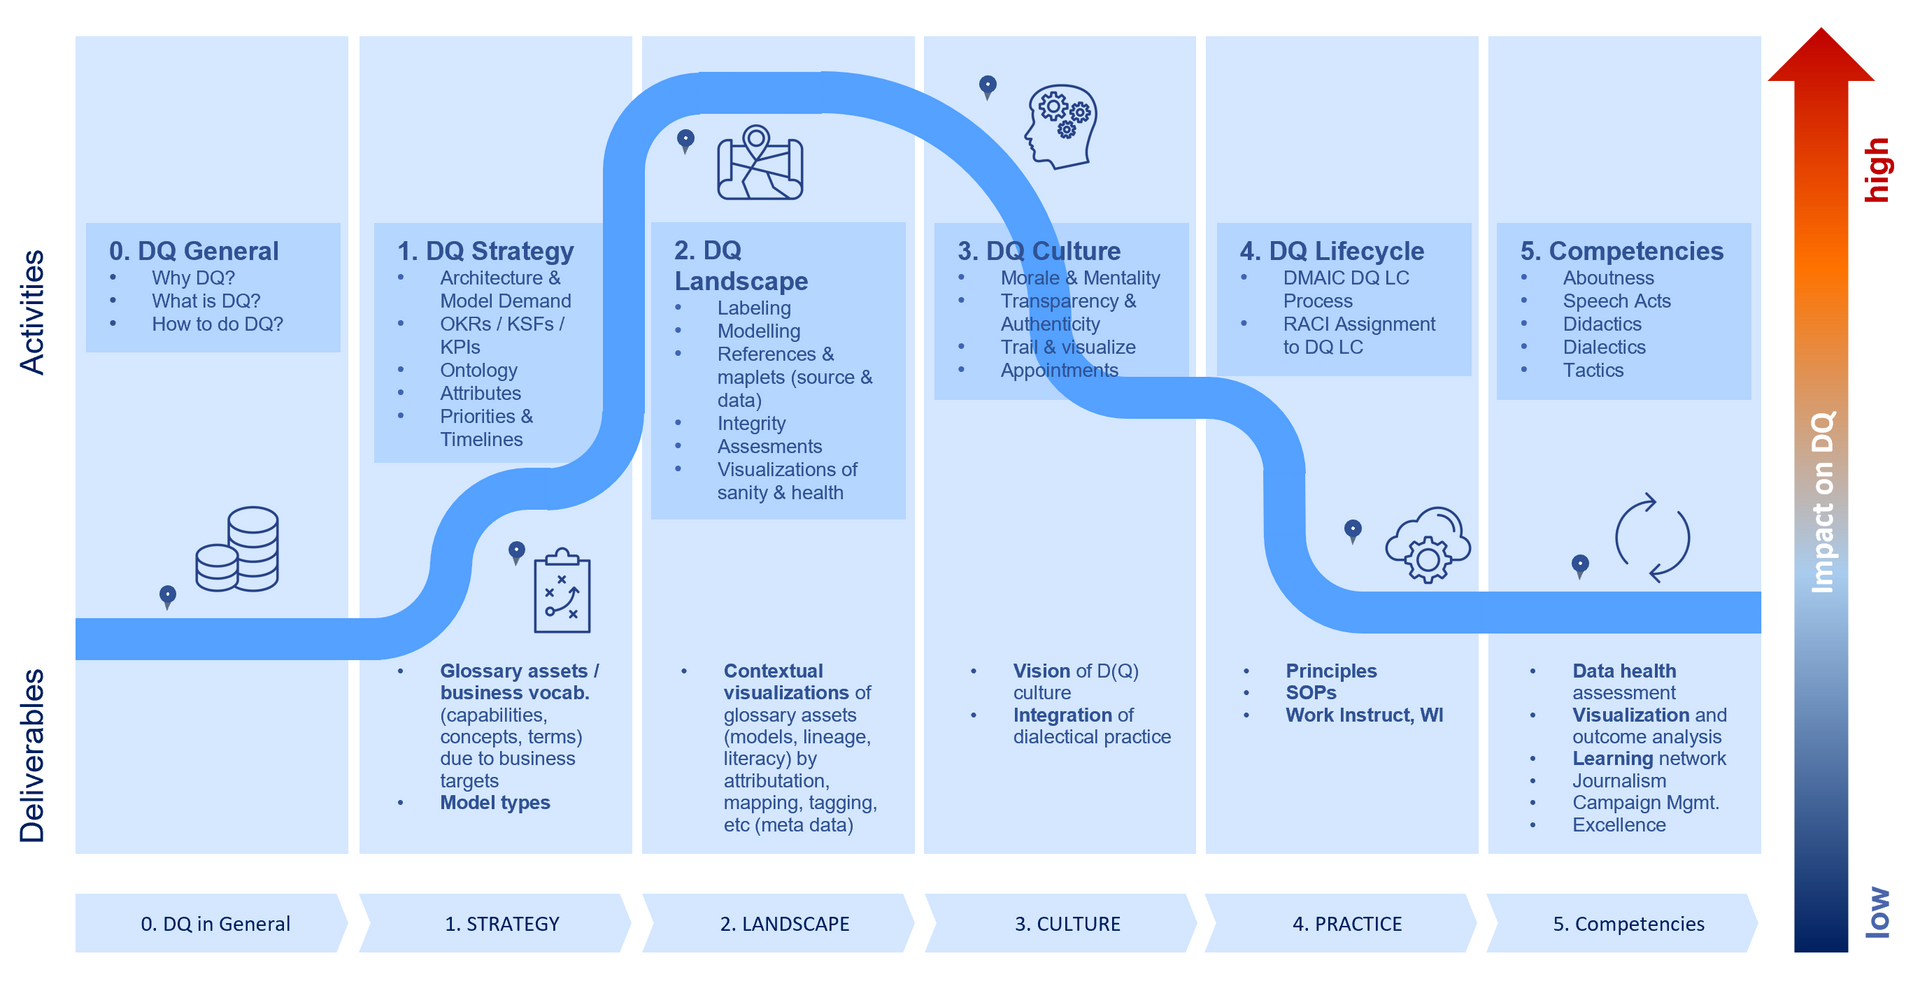
The DQ Road- and Heatmap visualizes the location of Principles, WI, and UJs as deliverables in phase 4. Practice.
Appropriate activities are casted in the SixSigma DMAIC DQ Lifecycle and crossed with governance roles and RACI responsibilities. DMAIC stands for a DQ methodology with the phases Define, Measure, Analyze, Improve, and Control.
Beyond, right DQ roadmap prominently shows which other phases (1. Strategy, 2. Landscape, 3. Culture) and their components Principles, WI, and UJ are going through, becoming valuable deliverables. Principles, WIs, and UJs that are well coordinated between stakeholders generate solid DQ levels and trust in data.
On top the fat blue curve demonstrates which phase with its content & deliverable has most impact on DQ – and DQ levels are significantlyimpacted by 2. Landscape and 3. Culture.
The proposition in a nutshell:
- The graph helps to locate Principles, WIs, and UJs, mentally in a picturized, recallable way
- The graph anticipates which methodologies do write out Principles, WIs, and UJs
- The graph demonstrates phase significances on trust in data (and quality)
This trust can be turned in credibility once levels of phases 0 – 4 have been enriched by 5. Competencies that are reinforcing trust in data.
Know-how:
"Create Principles, Work Instructions, and User Journeys and use the full stack of Mind-, Road-, and Heatmaps to give orientation at each stage to any data stakeholder"
The Roadmap in a nutshell:
- DQ Strategy is composed by a glossary of data assets with vocabularies on capabilities, concepts, and terms - and a roadmap of required processes
- DQ Landscape describes DQ business rules labeled by integrity & assessments (references & recommendations) towards sufficient DQ
- DQ Culture describes how groups perceive DQ and offers mental techniques of mutual acknowledgement
- DQ Practice guides data consumers with efficient DQ processes in variants of Principles, WIs and UJs
- Competencies anticipate how achieved DQ levels over time can be turned and tuned
Advice: Link DQ Roadmap and Heatmap with the Mindmap on the page Credibility to obtain the full picture of DQ, Governance, and Competencies. You will then deduct a better idea of the concept Credibility in Data.
